Share this:
Posted in:
Press Releases[fusion_builder_container hundred_percent=”no” hundred_percent_height=”no” hundred_percent_height_scroll=”no” hundred_percent_height_center_content=”yes” equal_height_columns=”no” menu_anchor=”” hide_on_mobile=”small-visibility,medium-visibility,large-visibility” status=”published” publish_date=”” class=”” id=”” background_color=”” background_image=”” background_position=”center center” background_repeat=”no-repeat” fade=”no” background_parallax=”none” enable_mobile=”no” parallax_speed=”0.3″ video_mp4=”” video_webm=”” video_ogv=”” video_url=”” video_aspect_ratio=”16:9″ video_loop=”yes” video_mute=”yes” video_preview_image=”” border_size=”” border_color=”” border_style=”solid” margin_top=”” margin_bottom=”” padding_top=”” padding_right=”” padding_bottom=”” padding_left=””][fusion_builder_row][fusion_builder_column type=”1_1″ layout=”1_1″ spacing=”” center_content=”no” link=”” target=”_self” min_height=”” hide_on_mobile=”small-visibility,medium-visibility,large-visibility” class=”” id=”” background_color=”” background_image=”” background_image_id=”” background_position=”left top” background_repeat=”no-repeat” hover_type=”none” border_size=”0″ border_color=”” border_style=”solid” border_position=”all” border_radius=”” box_shadow=”no” dimension_box_shadow=”” box_shadow_blur=”0″ box_shadow_spread=”0″ box_shadow_color=”” box_shadow_style=”” padding_top=”” padding_right=”” padding_bottom=”” padding_left=”” margin_top=”” margin_bottom=”” animation_type=”” animation_direction=”left” animation_speed=”0.3″ animation_offset=”” last=”no”][fusion_text columns=”” column_min_width=”” column_spacing=”” rule_style=”default” rule_size=”” rule_color=”” hide_on_mobile=”small-visibility,medium-visibility,large-visibility” class=”” id=””]
Visual One 5.0 has officially launched! We took the feedback provided by our current clients and users and have rolled out a series of new features and use cases. So, you’re probably wondering – how can this benefit you?
[/fusion_text][fusion_text columns=”” column_min_width=”” column_spacing=”” rule_style=”default” rule_size=”” rule_color=”” hide_on_mobile=”small-visibility,medium-visibility,large-visibility” class=”” id=””]
The focus of this release was:
User Interface Improvements
- Improved Speed
- Improved Flexibility / Customization
- Improved Visual Landscape
- (ie more room on the screen to display the information important to you for improved decision making)
- Improved Drill Down Capabilities
- Enhanced Customization Features
- User defined screen views and data displays
Additional Functionality
- All Things Infrastructure
- Collect from all infrastructure devices
- Dashboards for all categories of devices to summarize across family of devices
- Switches
- VMware Environments
- Host Summary (Physical & Virtual)
- Backup Servers
- Business Mapping Dashboards
- …and soon Hyper converged environments
- Improved NAS/File Analytics
- Summarize data across all or sets of shares
- Analyze user defined groups
- Trending over time of share/group data
[/fusion_text][fusion_text columns=”” column_min_width=”” column_spacing=”” rule_style=”default” rule_size=”” rule_color=”” hide_on_mobile=”small-visibility,medium-visibility,large-visibility” class=”” id=””]
Both V4 and V5 are available simultaneously to access your data. These two interfaces allow customers to choose the interface they are most familiar with and/or prefer and they will be available for the next 6 months together. They both access a common data base but all future enhancements will be implemented in V5.
[/fusion_text][fusion_text columns=”” column_min_width=”” column_spacing=”” rule_style=”default” rule_size=”” rule_color=”” hide_on_mobile=”small-visibility,medium-visibility,large-visibility” class=”” id=””]
Dashboards Everywhere
V4 of Visual One was primarily a storage analytics and reporting tool and as new features were added, these features were “bolted on” to the existing application. V5 was built for Infrastructure Analysis. Clients will get a dashboard, like V4 provided for storage, for all the major categories of devices including:
- Hosts (All Hosts – Physical & Virtual)
- SAN Switches (summary across all switch environments)
- VMware
- Backup Servers
- Business showback/chargeback reports
[/fusion_text][fusion_imageframe image_id=”3521|full” max_width=”” style_type=”” blur=”” stylecolor=”” hover_type=”zoomin” bordersize=”” bordercolor=”” borderradius=”” align=”none” lightbox=”no” gallery_id=”” lightbox_image=”” lightbox_image_id=”” alt=”” link=”” linktarget=”_self” hide_on_mobile=”small-visibility,medium-visibility,large-visibility” class=”” id=”” animation_type=”” animation_direction=”left” animation_speed=”0.3″ animation_offset=””]https://visualoneintelligence.com/wp-content/uploads/2019/05/Dashboard-views-.png[/fusion_imageframe][fusion_separator style_type=”none” hide_on_mobile=”small-visibility,medium-visibility,large-visibility” class=”” id=”” sep_color=”” top_margin=”20″ bottom_margin=”” border_size=”” icon=”” icon_circle=”” icon_circle_color=”” width=”” alignment=”center” /][fusion_text columns=”” column_min_width=”” column_spacing=”” rule_style=”default” rule_size=”” rule_color=”” hide_on_mobile=”small-visibility,medium-visibility,large-visibility” class=”” id=””]
The V5 user interface allows you to select the “enterprise view” from whatever category of device you are collecting and tracking information – including Business Unit, Storage, Hosts, VMWare, Back Up and SAN Switches. It also provides a full set of charts and analysis including trend analysis and forecasting for each category of device.
[/fusion_text][fusion_text columns=”” column_min_width=”” column_spacing=”” rule_style=”default” rule_size=”” rule_color=”” hide_on_mobile=”small-visibility,medium-visibility,large-visibility” class=”” id=””]
The image below is a VMware dashboard summarizing all VMware environments within an enterprise.
[/fusion_text][fusion_imageframe image_id=”3522|full” max_width=”” style_type=”” blur=”” stylecolor=”” hover_type=”zoomin” bordersize=”” bordercolor=”” borderradius=”” align=”none” lightbox=”no” gallery_id=”” lightbox_image=”” lightbox_image_id=”” alt=”” link=”” linktarget=”_self” hide_on_mobile=”small-visibility,medium-visibility,large-visibility” class=”” id=”” animation_type=”” animation_direction=”left” animation_speed=”0.3″ animation_offset=””]https://visualoneintelligence.com/wp-content/uploads/2019/05/Enterprise-VM-summary-.png[/fusion_imageframe][fusion_separator style_type=”none” hide_on_mobile=”small-visibility,medium-visibility,large-visibility” class=”” id=”” sep_color=”” top_margin=”20″ bottom_margin=”” border_size=”” icon=”” icon_circle=”” icon_circle_color=”” width=”” alignment=”center” /][fusion_text columns=”” column_min_width=”” column_spacing=”” rule_style=”default” rule_size=”” rule_color=”” hide_on_mobile=”small-visibility,medium-visibility,large-visibility” class=”” id=””]
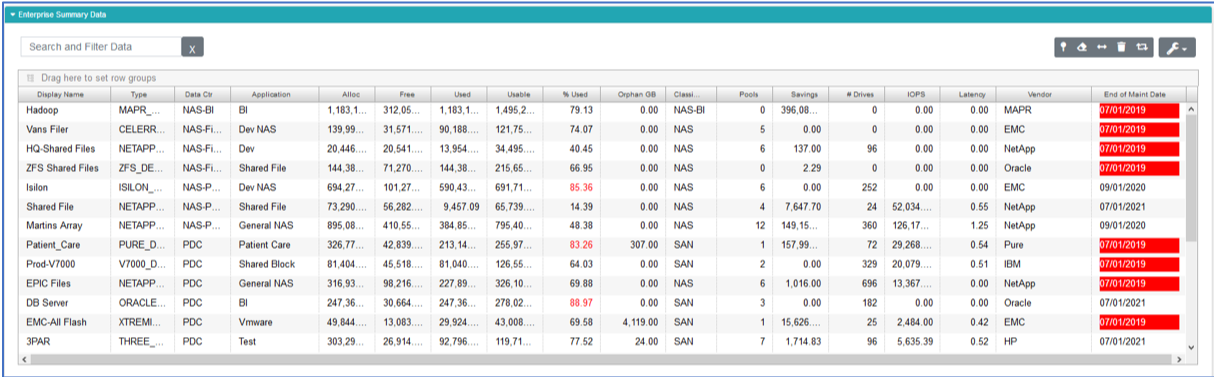
NAS Analytics
The new NAS analytics feature allows you to track both growth and performance by class of device. For example, backup and file storage devices typically have different growth and performance patterns. Having the ability to track and gain insight into where and by how much your growth is occurring allows clients to plan for purchases of the right kind of storage versus making emergency purchases, or worse – using the wrong storage for the wrong purpose “because it is available”. Oftentimes this results in using high performance storage for low performing applications and once resident on this type of storage – it is often difficult to change this in the future.
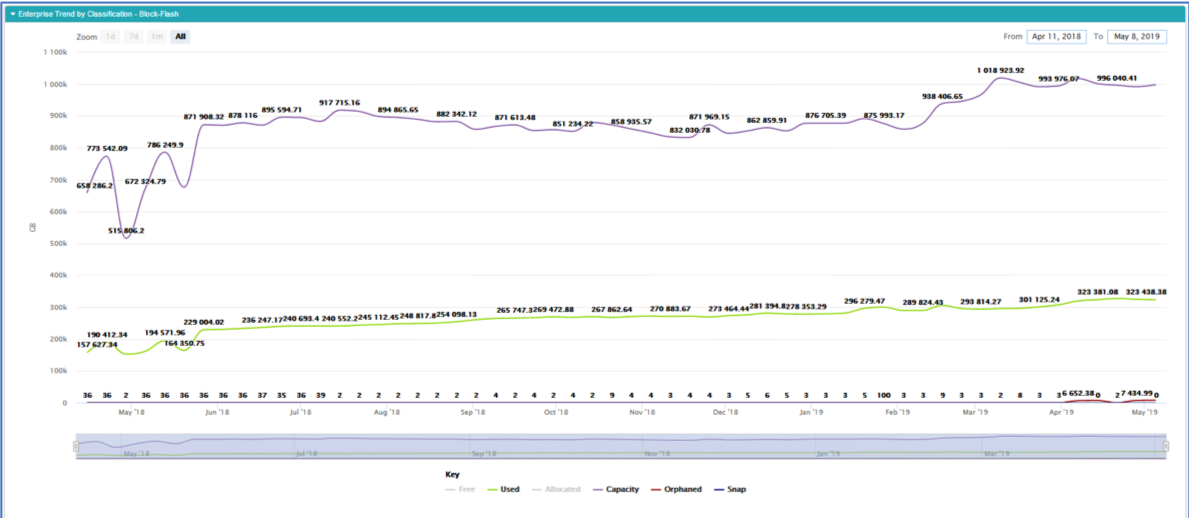
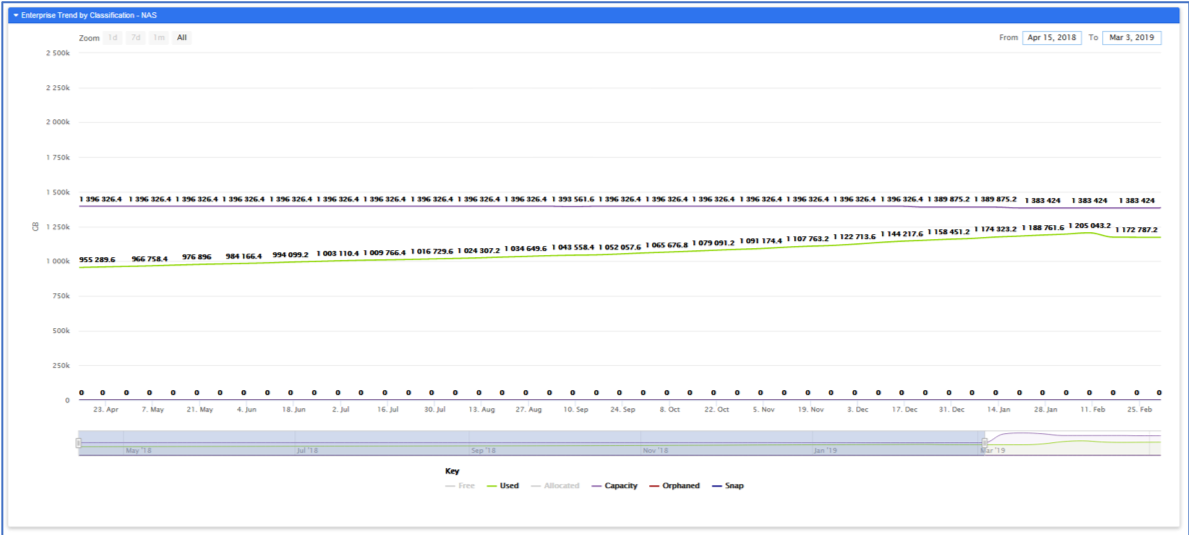
The examples below show the growth of high performance “block flash” vs NAS (unstructured data storage) – and while block flash is critical to the business, you can see there is plenty of space for these applications. The high growth in this customer environment is on their unstructured data, which appears to be increasing at 100 TB/month.
[/fusion_text][fusion_text columns=”” column_min_width=”” column_spacing=”” rule_style=”default” rule_size=”” rule_color=”” hide_on_mobile=”small-visibility,medium-visibility,large-visibility” class=”” id=””]
Block Flash Growth Trends
[/fusion_text][fusion_text columns=”” column_min_width=”” column_spacing=”” rule_style=”default” rule_size=”” rule_color=”” hide_on_mobile=”small-visibility,medium-visibility,large-visibility” class=”” id=””]
NAS Growth Trends
[/fusion_text][fusion_text columns=”” column_min_width=”” column_spacing=”” rule_style=”default” rule_size=”” rule_color=”” hide_on_mobile=”small-visibility,medium-visibility,large-visibility” class=”” id=””]
Finally, Visual One5 provides a much larger landscape to display information – allowing clients to select and view the information they prefer to see “on the fly”.
[/fusion_text][fusion_text columns=”” column_min_width=”” column_spacing=”” rule_style=”default” rule_size=”” rule_color=”” hide_on_mobile=”small-visibility,medium-visibility,large-visibility” class=”” id=””]
Our main goal is to provide a product that allows you to be more proactive in managing your storage environment. As always, we welcome any feedback you may have.
Sincerely,
[/fusion_text][/fusion_builder_column][/fusion_builder_row][/fusion_builder_container]