
Accelerate & Simplify Brocade & CISCO SAN Switch Environments
Total Architecture Visibility
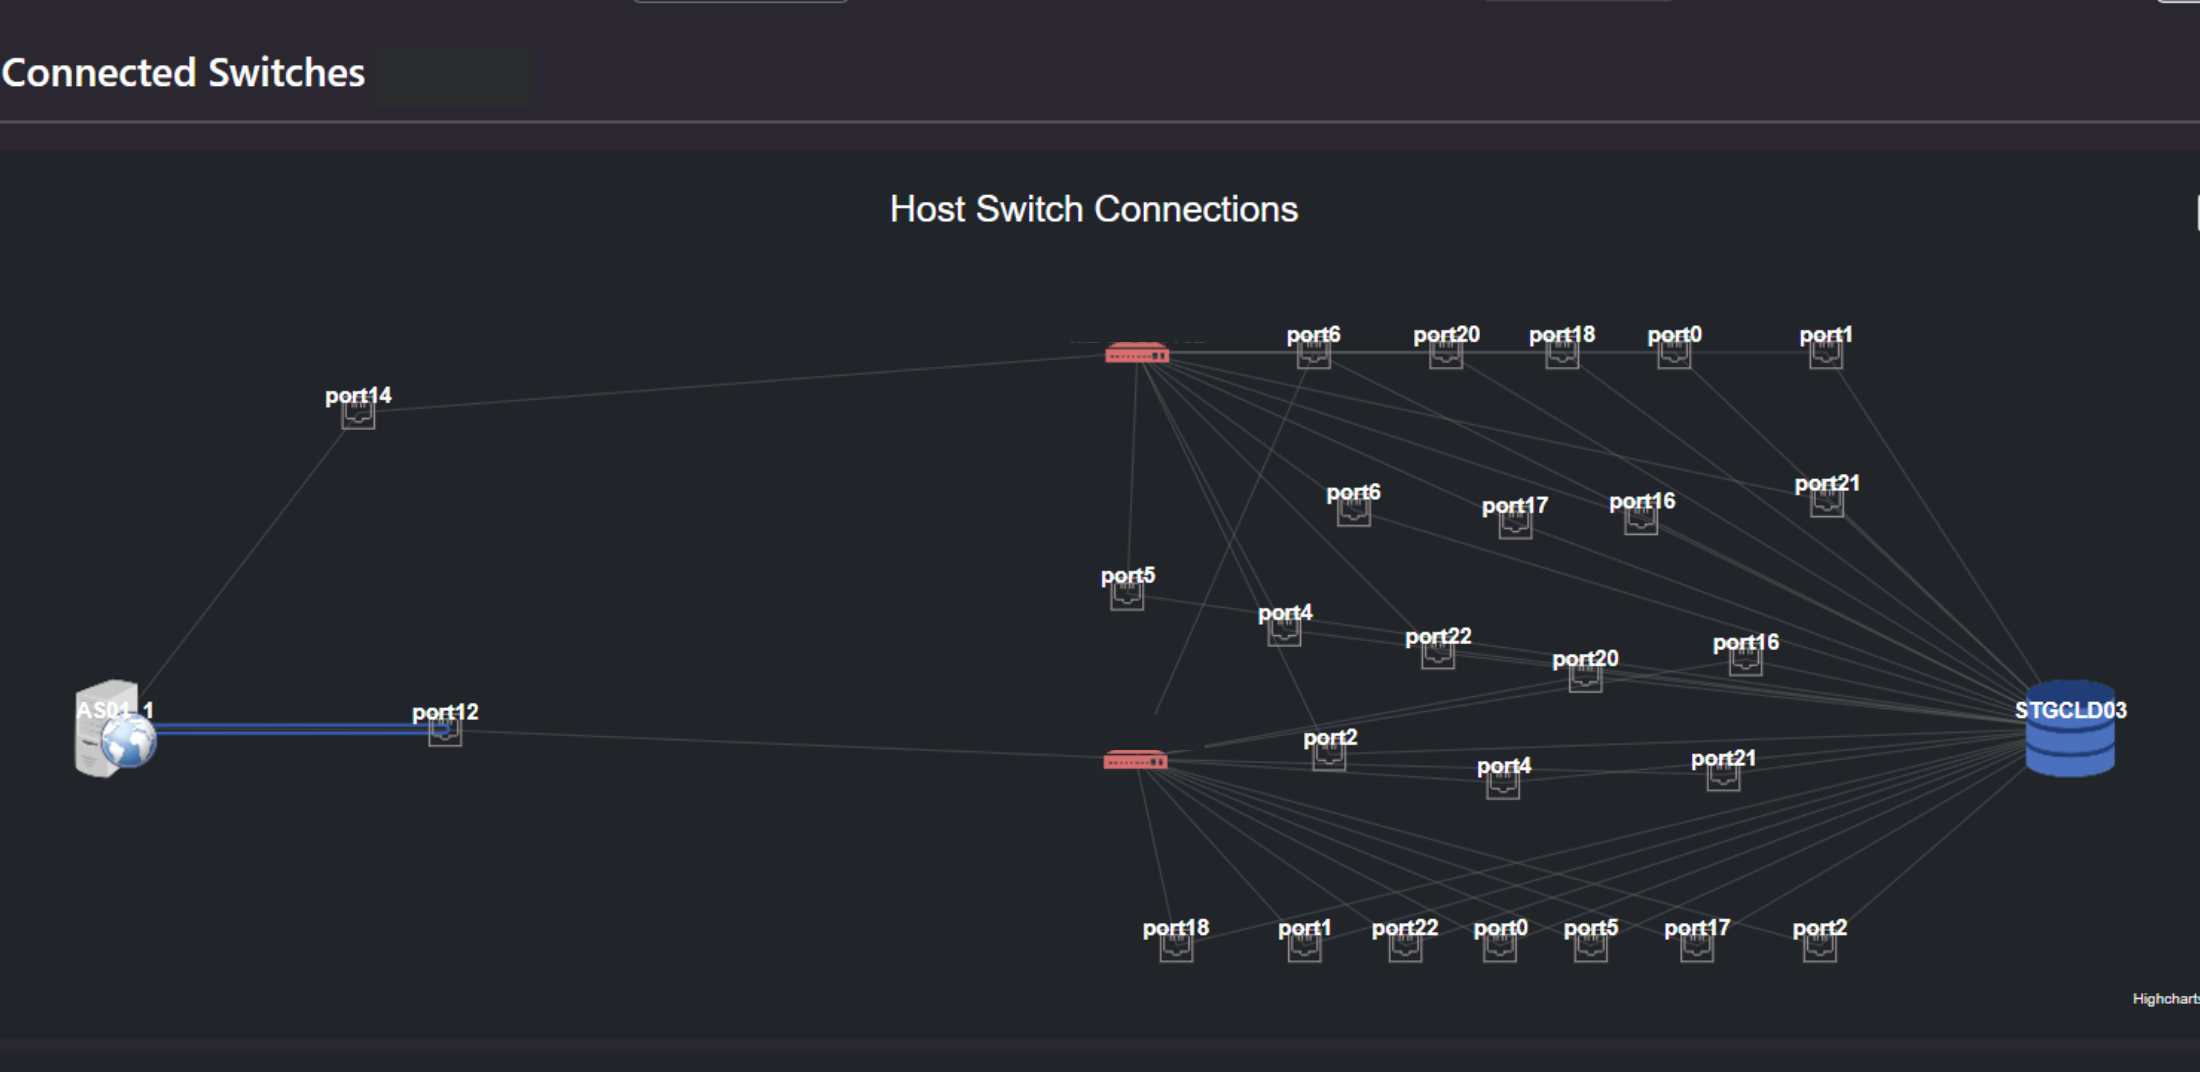
Global topology maps details about SAN connections at port, host, and device levels and correlates SAN data with the rest of your cloud, compute, and storage environment.
Discover new switches and track configurations with ease – including automatic host connection listings that don’t require manual input.
Ensure Continuity Across SAN & Hybrid Infrastructure
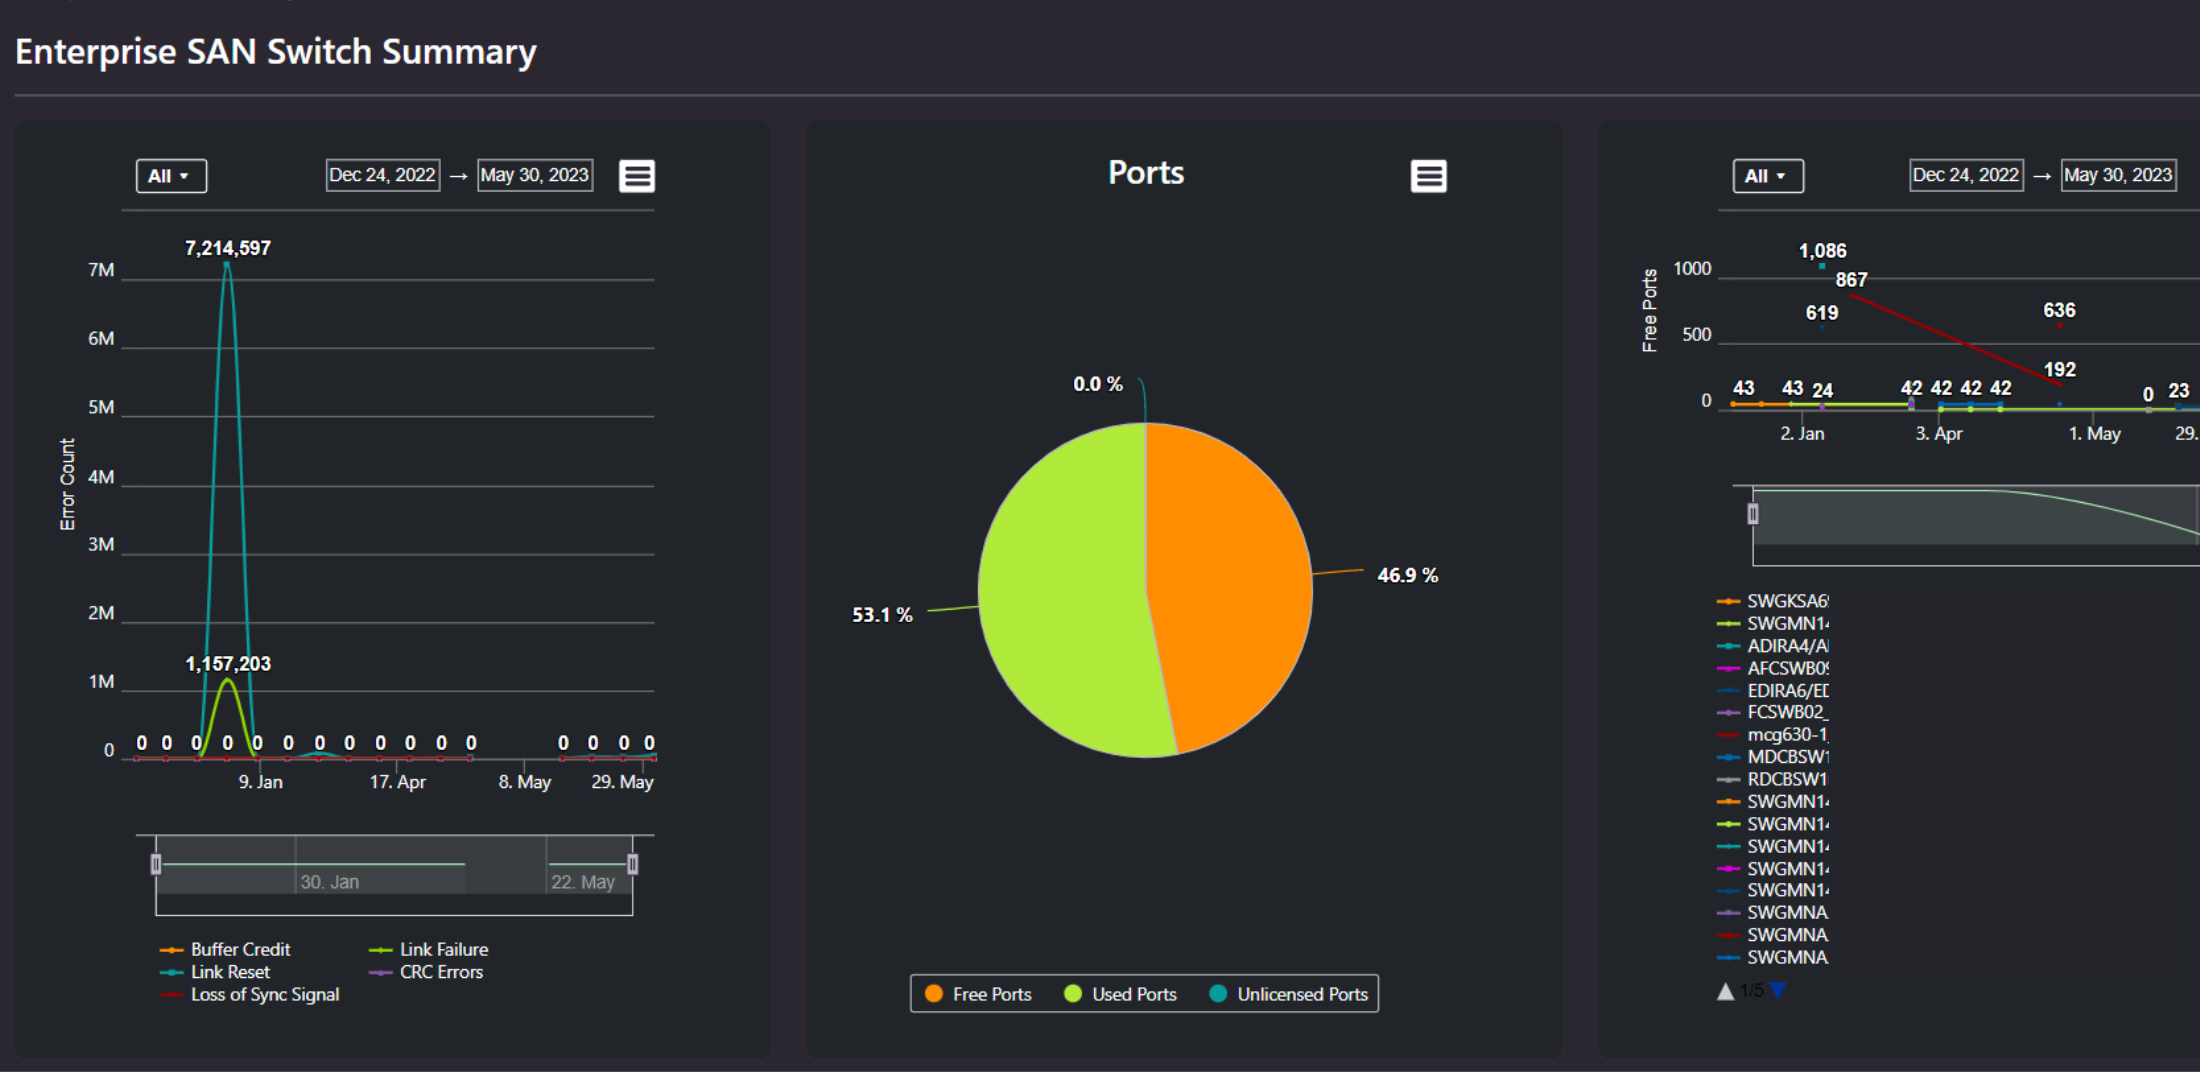
Monitoring and health summaries give you preventative insights into the state of your switches, including the ability to drill down by port or device to locate root causes.
Our integration with ServiceNow makes it as easy as a single click to start remediations.
Optimize Switch Utilization & Performance
Enhance switch ROI with a full suite of capacity planning abilities.
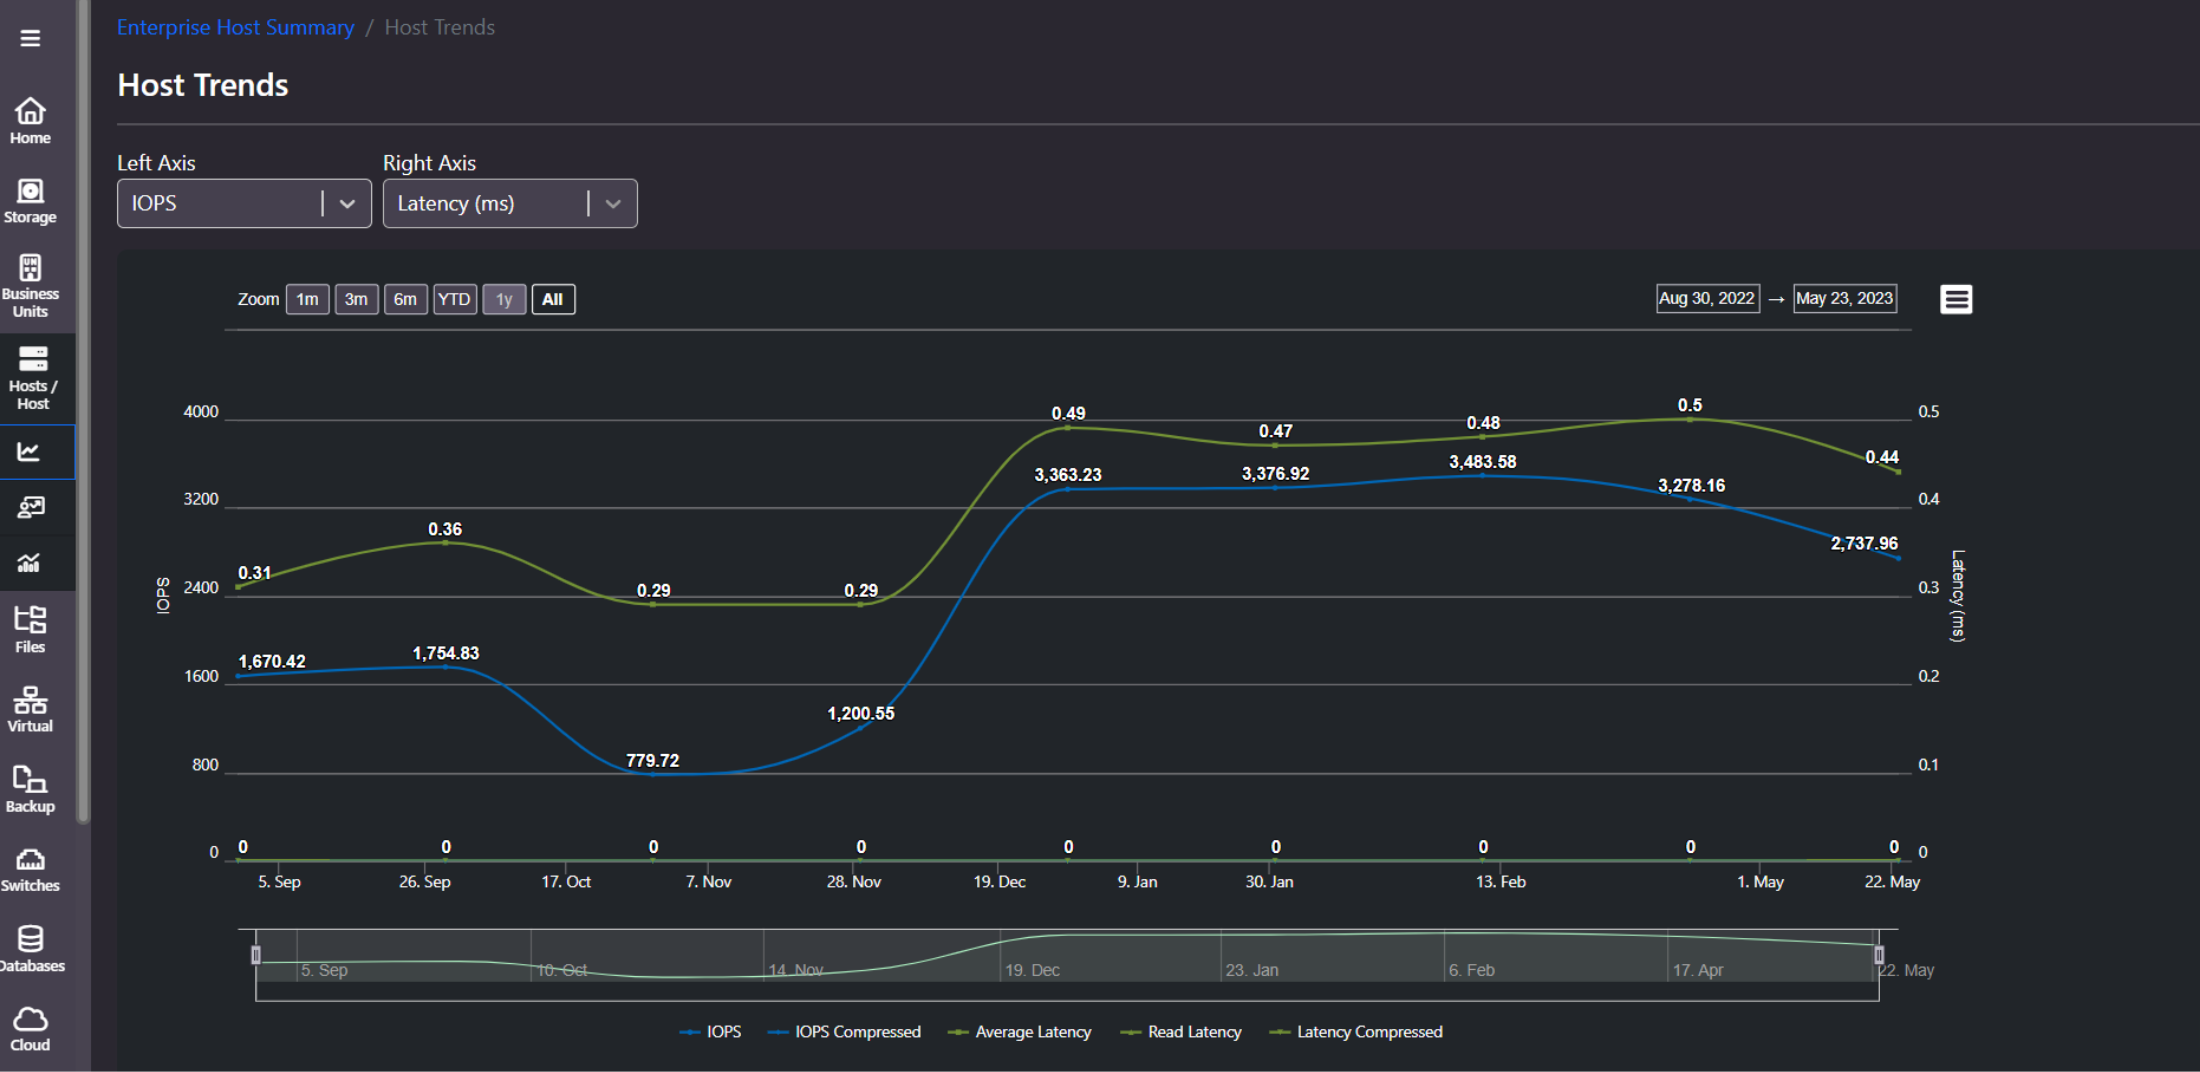
Review performance trends over time to ensure peak operability.
Rely on automatic end of life / support calendars – plus the option of continued support even after your device’s EOSL

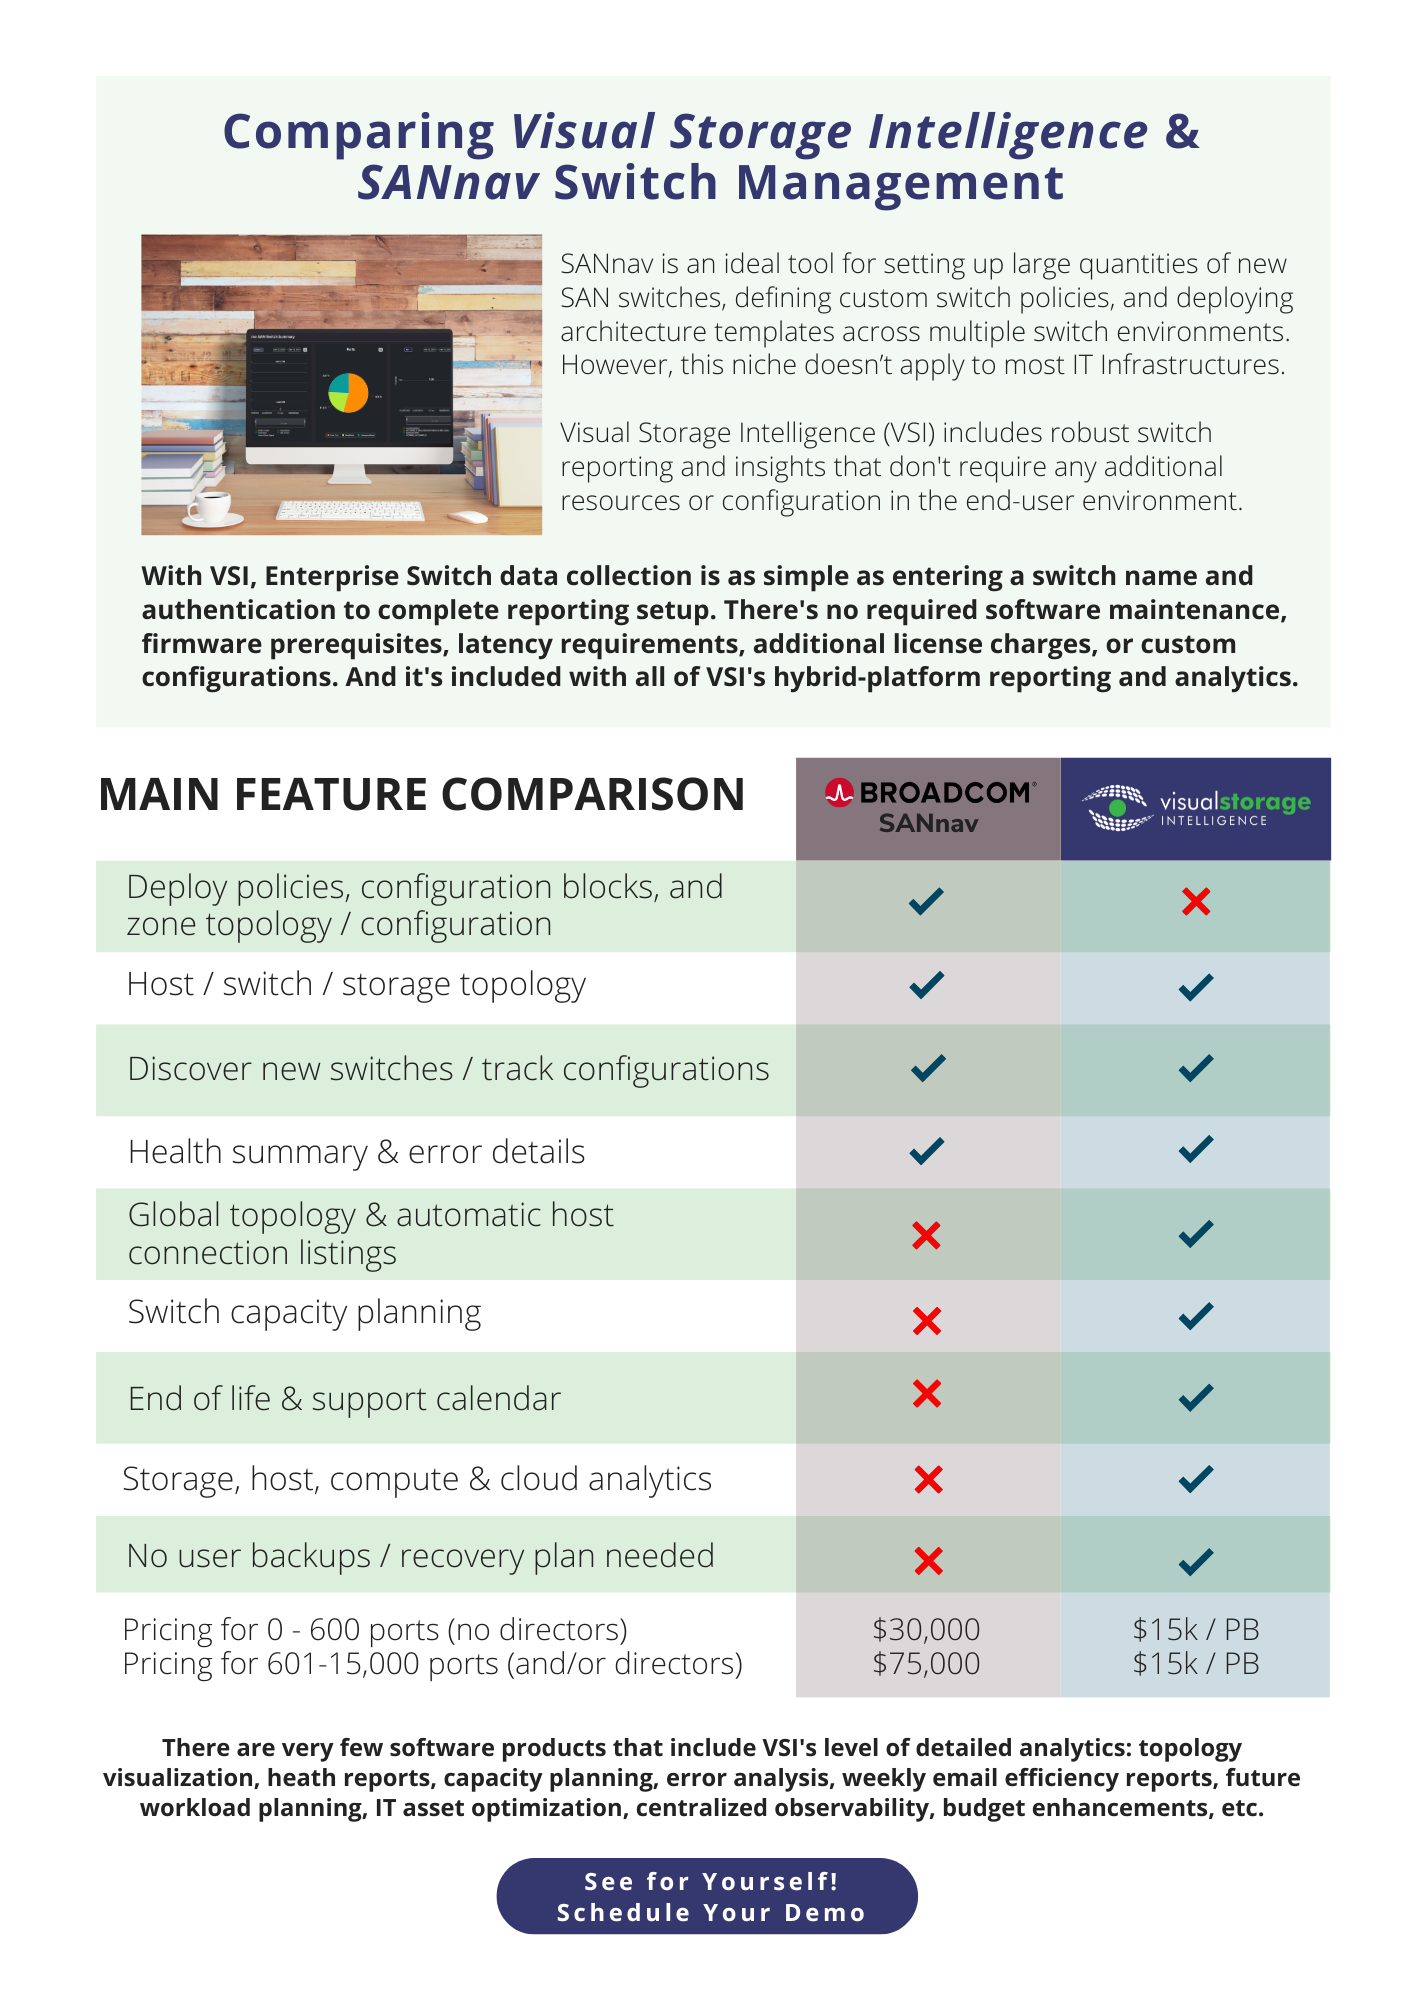
How Visual One Intelligence Compares with SANnav

Four Overlooked SAN Switch Details Every Storage Architect Should Monitor
SAN Switch Monitoring FAQs

Read More Storage Management Insights

More Than Monitoring: Prevention is the New Standard in IT Infrastructure
READ MORE >>
Breaking Response Cycles in IT Monitoring
READ MORE >>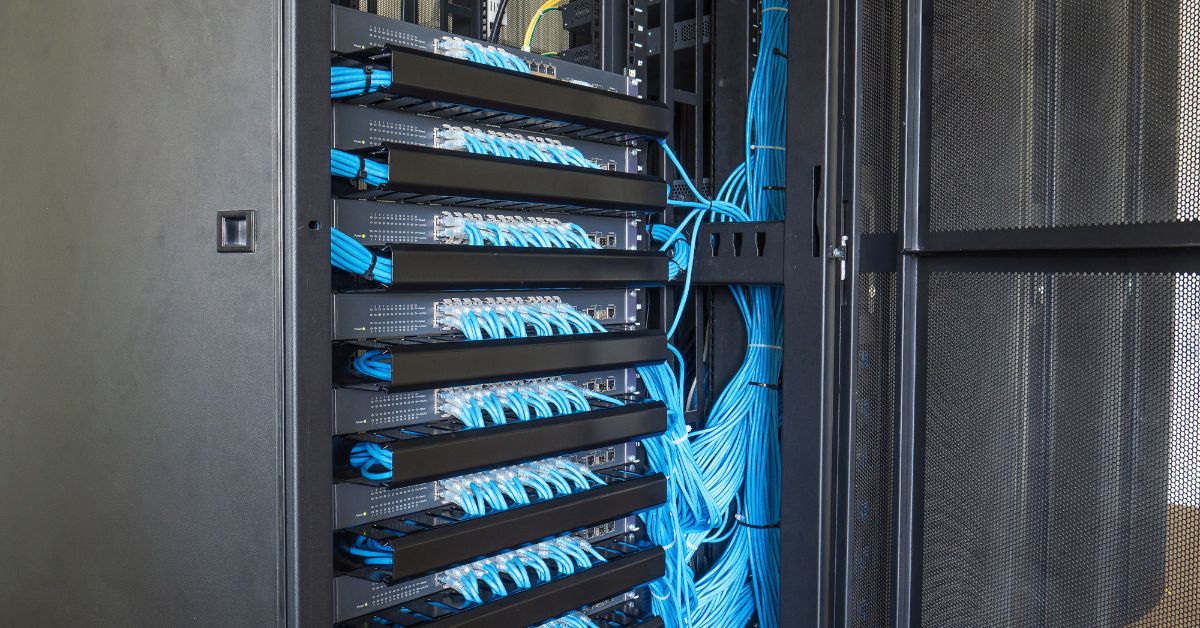
Four Overlooked SAN Switch Details Every Storage Architect Should Monitor
READ MORE >>
Four Steps to Operational Excellence in IT Storage Environments
READ MORE >>Follow Us for More IT Transformation Insights