Share this:
We’ve all heard about it. “Operational excellence” is one of the most popular frameworks in workplaces today. Chances are, your organization has made it a strategic priority.
Operational excellence in IT is “the point at which each and every employee can see the flow of value to the customer and can fix that flow before it breaks down” (according to the aptly named Institute for Operational Excellence).
Essentially, it is a commitment to bridging any operational gaps – orchestrating seamless and efficient operations for the maximum benefit of customers and end users.
Four Pillars of Operational Excellence in IT
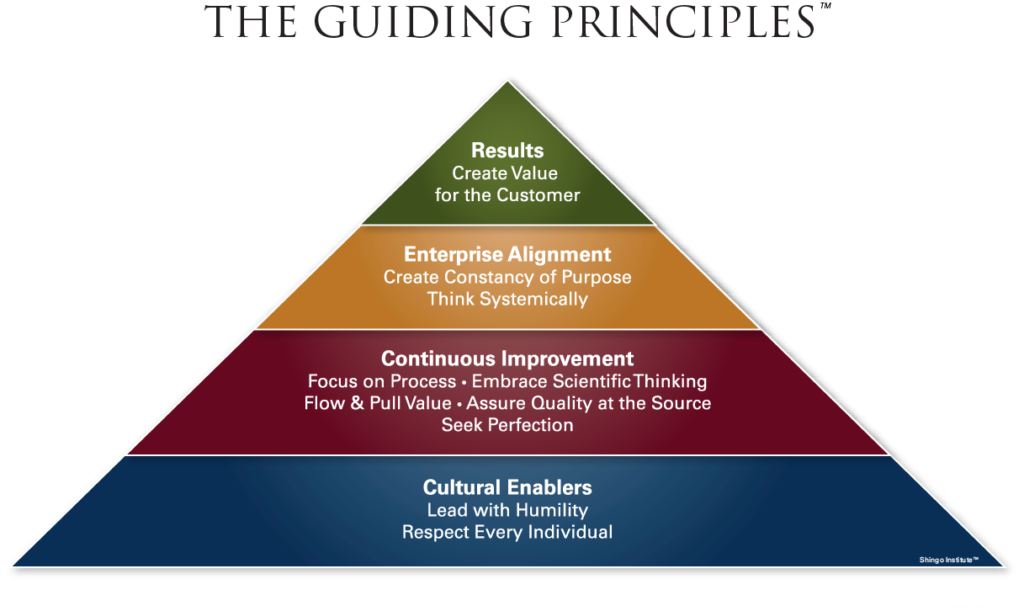
One popular model of organizational excellence, Utah State University’s Shingo Model, relies on a pyramid of four principles – each building on the other.
At their essence, they prompt organizations to ask themselves the following:
- People – Is our culture as conducive to self-improvement as it can be?
- Process – Are our practices as efficient as they can be?
- Transparency – Is our team as unified as it can be?
- Results – Are our operations as effective as they can be?
These questions are a good starting point for IT storage & infrastructure leaders who want to plan for comprehensive operational excellence strategies and KPIs.
Laying a Foundation for Excellence: Prioritizing People
“Is our culture capable of self-improvement?”
At the core of any strategic framework is people. They are more fundamental than strategies, metrics, or even financial resources.
No mission statement, KPIs, or company principles can impact a team without the right culture. Before you can map out metrics for operational excellence, you need to establish the right culture – specifically, a culture of self-improvement.
Rigid or bureaucratic work environments can stifle self-improvement. Employees who are micromanaged based on arbitrary or excessive standards will work to stay within those standards – but not to improve or innovate.
That’s a problem if you’re aiming for operational excellence, which is inherently about improvement.
A foundational KPI, then, is not about statistics or numbers at all. Nor is it about other people’s performance. Instead, it’s about us: How do I treat others?
You might be tempted to skip this and move straight to other more traditional KPIs.
Don’t do it.
A unified and motivated team is the foundation of innovation.
Always Improving: Making Processes More Efficient
“Are our practices wasting time or money?”
In IT infrastructure, there are lots of moving pieces to manage: storage allocations, capacity planning, workload management, migrations, monitoring, etc.
Any one of them can take up way too much time for admins and engineers – with middling results. That’s why a cornerstone of operational excellence is evaluating and transforming processes for greater efficiency.
Because “time is money,” efficiency involves optimizing processes for better outcomes using less time and/or less money.
Take storage provisioning as an example. Is your team’s provisioning process placing any data on expensive devices when there is free space the data could be assigned to instead? How often does this happen, and why?
Perhaps it is because the free space is fragmented between pools, or there’s seemingly not sufficient space on a single device. Or maybe it’s because there are outdated allocations which are no longer in use (ie: nothing is mapped to it even though it’s technically provisioned) – giving the appearance of unusable space when in fact the space is available.
The point is to notice the cost and/or time inefficiency and seek to find the cause. There may be a way to address the underlying cause and thereby improve the overall process.
Here are some more process-oriented KPIs to consider:
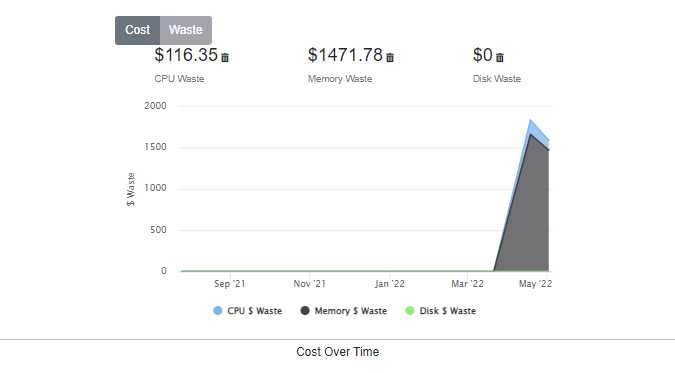
KPI: Total cost of unused space
Regardless of why the space is unused, empty space is wasted space. How much money is being spent on wasted space?
That might feel like a harsh way to look at things (on-prem devices, for example, should never be completely full), but if the cost is going up over time you’ll want to know why. Plus, seeing it in financial terms (instead of storage units) adds urgency.
And if you’re in the cloud, there’s definitely nothing harsh about this KPI. You need to know how much you’re spending vs. how much you’re using, since you pay for space whether you use it or not!
KPI: % of Tier 1 storage allocations untouched in 12+ months
The timeframe can vary (6 months, 24 months … whatever is most helpful), but the goal is to identify logjams in your storage.
If the amount of untouched data is decreasing over time, that’s a good sign of strong tiering / archiving practices. But if it’s increasing, ask why and investigate whether your processes can change to move eligible data sooner.
File analysis tools like ours at Visual One Intelligence, for example, can help you find that eligible data quickly (scanning over 1 billion records per hour, in our case).
KPI: FTE hours devoted to reporting
Again, this is just an example and you may track something slightly different. The purpose of this kind of KPI is to monitor how much of your talented team’s time (and salary) are spent on routine or automatable tasks.
These are easy opportunities to reclaim time for higher-leverage tasks and use your most valuable resource – your team – for more valuable ends.

Fortune 500 Case Study
“Capacity Planning Automation Reduced Our Reporting Time by 50%”
Working Together: Building Unity Through Transparency
“Is information as accessible as it can be?”
When your culture puts people in position to succeed – and your practices are optimized to create that success – the next consideration is transparency.
Without appropriate transparency, it is hard for a team – much less an organization – to function as a cohesive unit. Everyone may achieve individual success, but operational excellence is about the team and organization as a whole.
Each person’s successes, information, and expertise are like rungs on a ladder. A single rung won’t accomplish much on its own, but when all the rungs are put together everyone can climb all the way to the top.
The key here is data accessibility. Where are silos blocking actionable data from appropriate team members? Are the silos a result of official policies, informal habits, divisions of labor, personalities, or something else?
Sometimes, a simple lack of shared data can result in communication breakdowns and intra-office conflicts or finger-pointing. When there is not a shared single source of truth, there can’t be agreement about when something is a success or failure – or what action caused the success / failure.
To some degree, this is something you just have to watch for as a leader. Still, here are some sample KPIs that can help in IT infrastructures:
KPI: Mean time until report generation
How much time is there between a request for data and the data report itself? The answers may differ depending on the report, but look for any that take especially long and ask why.
Is it because the data is hard to obtain? Is it because only certain people have access to the data and are too busy to build the reports?
There might be some data requests that cannot reasonably be fulfilled at all. In these cases, your team is working completely in the dark. Look for the obstacle and find a way to remove it.
KPI: # of reports needed for a single pane of glass
For any given metric, how many separate reports do you need to generate in order to view and compare your entire storage environment’s performance in that metric?
In other words, does one report show you the relevant data for all your storage devices? Or do you need to combine multiple reports in order to compare all your devices? (Ex: one report for your NetApp devices, one for Nutanix, and one for the cloud).
No matter how many kinds of storage you use, you want this KPI as close to 1 as possible (hence the term single pane of glass).
Otherwise, everyone on your team has blurry vision when they look at your infrastructure. And when people have blurry vision, it’s easy for everyone to think they see something different.
KPI: Costs per department (chargeback / showback)
This metric looks at a totally different category of data: budgetary expenses.
For IT teams, knowing how much each department (or business unit) spends on software or storage helps them purchase and allocate those resources more effectively.
For other staff and leaders in those departments, the information helps them evaluate their own usage and look for any waste or gaps in resources. (For example, maybe they ask for 500 GB of storage each year but have never used more than 200. They should either start using it or stop requesting it!)
Whether using chargeback or showback, teams can improve with strong IT spending data.
Sweet Success: Ensuring Operational Efficacy
“Are our results as positive as they can be?”
IT infrastructure teams may not look at their work as “producing a product for a consumer,” but their efforts undoubtedly have outcomes and results that impact users.
For example, a healthy IT environment provides a network and storage capacity that everyone in the organization needs in order to do their jobs. But if that network goes down, or if there is a gap in allocating storage, it negatively impacts each and every user.
This is the final layer of operational excellence: the outcome itself.
It goes without saying that undesirable outcomes are opportunities for improvement. But sometimes it helps to trend the progression of outcomes over time. Here are a few example metrics for infrastructure teams:
KPI: Mean time between failures
This helps you track how often failures or outages occur – and if that number is increasing or decreasing over time. What is behind the failures? What would it take to reduce their frequency?
KPI: Alerts over time
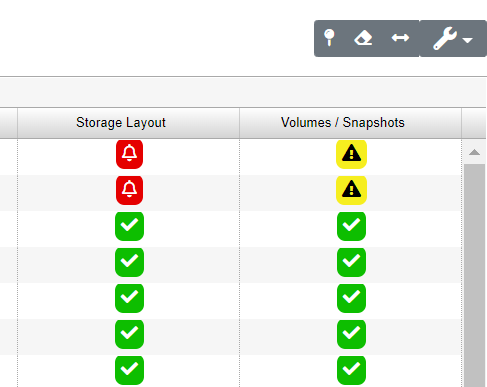
Are your alerts increasing or decreasing over time? Are there periods of time when alerts spike? Which ones, and why?
These are all indicators that can give you better insights into the potholes hiding under the surface of your infrastructure, so you can better predict when they might occur and how to prevent them.
KPI: Actual capacity vs expected capacity
Is your capacity planning helping you plan accurately, or are you getting caught by surprise?
This metric helps measure the success of capacity planning efforts by simply comparing initial expectations with actual outcomes.
If you have more actual capacity than anticipated, great! But if you consistently have less, your planning is not doing you any favors. In fact, it could be costing you quite a bit in last-minute storage purchases. Investigate where the disconnect in your projections is.

Enterprise Success Story
“Daily Health Alerts Reduced Capacity Ticket Submissions by 98%”
Operational Excellence in IT Has Never Been More Important for Storage & Infrastructure Teams
In the past, storage was relatively uniform (even if it didn’t feel like it at the time!) Data centers would manage storage hardware systems that were owned and operated by the company using them. Data would grow at a somewhat manageable rate, and dedicated employees would manage the storage data and hardware themselves.
But that’s not how it works anymore.
Exponential data growth is driving rapid innovation in data storage technologies, resulting in more complicated storage architectures. Year-over-year data growth is soon expected to outpace existing storage capacities. And with such rapid data accumulation, companies will continue seeking out alternatives like storage in the cloud, on the edge, or managed via software.
The result is bigger infrastructures stratified across more decentralized spaces.
As anyone who has moved to even just a hybrid cloud environment knows, new operational strategies are needed in these new environments.
That’s where Visual One Intelligence fills the gap. Whether you’re looking for a comprehensive infrastructure management tool or targeted help with capacity planning & performance management, we specialize in each and every element of IT mentioned above.
Seeing is believing – watch a demo or schedule an intro call to see how Visual One Intelligence can help you achieve greater operational excellence as soon as this year.


